
 0532-86151105
0532-86151105
0532-86151105

1. Prospect of petroleum and petrochemical industry in 2022
Looking back on the oil and petrochemical industry in the past year, after experiencing the impact of global public health events, the prices of crude oil and major downstream petrochemical products fell sharply and then showed a trend of recovery. At present, they have recovered above the central price level in recent years with the shock of global easing policies and changes in the epidemic situation. From the perspective of the machining price gap of traditional large petrochemical products, with the most typical two ethylene industry chain and polyester industry chain, for example, ethylene/naphtha spreads and PX - naphtha spreads are still at a relatively low price range, lags far behind oil recovery rate, which is the price from upstream to downstream transmission lag factors, More reflects the traditional bulk petrochemical products in the demand side of the weak growth; In contrast, some of the bulk chemicals with emerging demand, such as BDO, rose dramatically, far exceeding the recovery range of crude oil, showing a strong trend of supply and demand, and the petrochemical market shows a significant differentiation pattern.
As new emissions targets - "carbon dioxide emissions to reach peak before 2030, and strive to become carbon neutral before 2060" is put forward, and environmental regulations came into effect increasingly strict like the plastic forbidden, the way of petroleum and petrochemical industry development has brought great changes, especially in the field of fuel and bulk materials. Our annual strategy last year started from the fuel sector which directly affected by the policy in the petroleum and petrochemical industry, to elaborate the opportunities of the natural gas industry under the demand of clean and low-carbon fuel: in the short and medium term, we significantly increased the proportion of natural gas to replace coal and other high carbon fuels to reduce carbon emissions; In the long term, carbon neutralization can be achieved by using CCUS (carbon capture, utilization and storage) and hydrogen production from natural gas. In the path of carbon peak and carbon neutralization mentioned above, there is a huge incremental space for natural gas. In the past year, investment opportunities in the natural gas field have been verified by stages. Looking forward to next year, we will start from the petrochemical bulk materials field and expound the development prospect and broad space in the green and low-carbon materials industry chain under the new policy environment.
1.1 Global policies drive the rapid growth of biodegradable plastics
Due to the continuous environmental pollution and high carbon emissions caused by ordinary plastics in production, use and waste, it is increasingly deviating from the current environmental policy and the "dual carbon" goal. Corresponding alternative solutions are urgently needed. Biodegradable plastics come into people's sight as a substitute to solve the environmental pollution caused by plastic waste. Some biodegradable plastics also have the advantage of reducing carbon emissions in the production process. Therefore, under the direct drive of the intensive domestic plastic ban policy, plastic straws and other disposable plastic products will be removed from the shelves from the end of 2020 to the beginning of 2021. Subsequently, the performance shortcomings of paper straws and other substitutes make the market determine and accept degradable plastic as the best substitute. The resonance of domestic and foreign policies as well as multinational large enterprises respond in advance and in large scale to the policies, further promote the demand for degradable plastics blowout.
1.1.1 The global hazards of plastic waste are increasing day by day
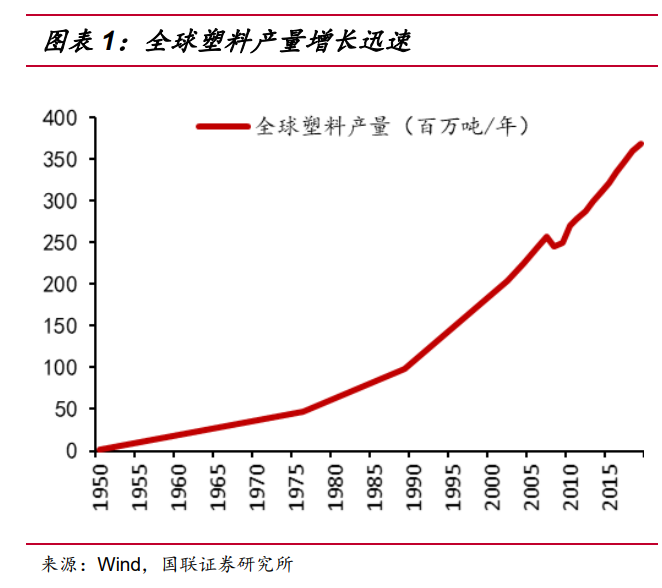
Since 1869, the world's first piece of plastic -- celluloid (nitrocellufibrate plastic) was born, plastic has developed more than 140 kinds of commercial plastic varieties including five general plastics, among which there are about 30 kinds of common varieties. At the same time, the growth of plastic production is also considerable, especially with the rapid development of petrochemical industry after World War II, the global plastic production capacity has increased from 1.7 million tons/year in 1950 to 368 million tons/year in 2019, an increase of more than 200 times. Its growth rate was much higher than that of global GDP (at constant prices) over the same period.
More than 150 years after plastic's birth, theoretically at least another 150 years are needed for the first plastics to fully degrade. In the 65 years from 1950 to 2015, the world has produced about 8.3 billion tons of plastic, which would form a 5,680 meter high mountain if stacked on the ground. Apart from the 2.5 billion tons that are still in their original state of use, the remaining 5.8 billion tons have been discarded or recycled: 4.9 billion tons are landfill or discarded, 800 million tons are incinerated, and only 100 million tons are recycled and reused (300 million tons are recycled and then discarded again). In terms of proportion, the vast majority of used plastic is actually discarded/buried (84.5%) and incinerated (13.8%). Including 2016-2019 production and 2020-2021 estimated production, the total production so far exceeds 10 billion tons, of which about 6.2 billion tons were abandoned and buried.
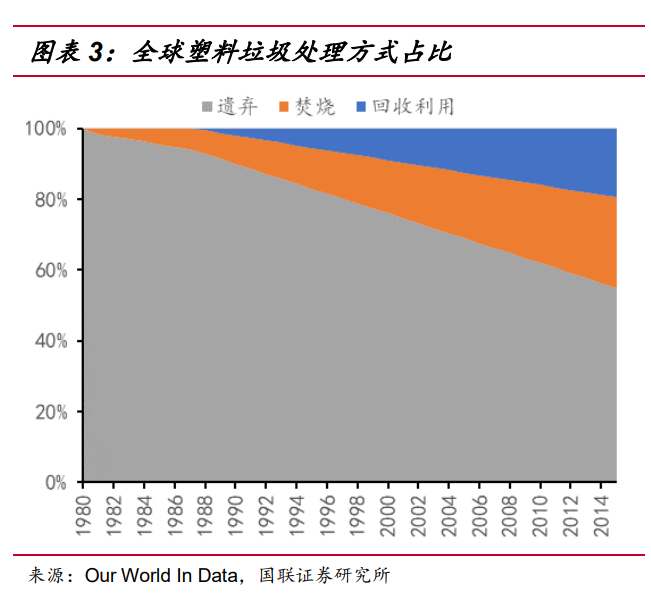
From the proportion of plastic waste treatment methods, the original plastic waste was completely abandoned after use. In 1981, part of the plastic waste was treated by incineration, and it was until 1988 that part of the plastic waste was recovered for reuse. In recent years, the proportion of incineration and recycling of plastic waste is increasing. By 2015, the above two treatment methods accounted for 25.5% and 19.5% respectively, and still more than half of plastic waste is abandoned (including landfills).
In terms of the recycling ratio of plastic waste, even the European Union, which has the most popular concept of environmental protection and the longest implementation of plastic waste recycling and utilization, only accounted for 30.4% of plastic waste recycling in 2015, while the global recycling rate was even lower, about 19.5%. Meanwhile, even in the European Union, plastic waste production is increasing year by year -- in 2018, the EU's plastic waste production increased by 3.56% month-on-month, while the global plastic waste production increased by 9.61% month-on-month. And while the amount of plastic discarded (including landfills) in the EU has been declining since 2008, the amount exported to other regions is not included in the statistics, and the amount of plastic discarded (including landfills) globally is actually still growing. According to the natural degradation cycle of plastics on land, almost all the plastic wastes abandoned (including landfills) are in the process of degradation. The annual accumulation increment of plastic wastes in the environment is equivalent to the amount abandoned (including landfills), and the trend is increasing year by year. The pollution situation of plastic wastes is becoming increasingly serious.
After plastic waste, the remaining parts on land, such as plastic bags/plastic film, will damage soil structure, influence plant root growth and reduce crop yield. According to the research, even the broken microplastics will hinder the growth of earthworms and other soil organisms, and the toxic additives added in the production of plastic will also be released, further endangering the soil ecosystem, making the soil more and more rigid, low yield, and threatening food security.
The most concern now is the plastic waste that thrown into the ocean and other waters, where it is thought to form microplastics, with wider and deep consequences. According to several studies, ingestion of microplastics can cause varying degrees of damage to the digestive tract of organisms, affecting the reproductive rate and enzyme activity of some organisms. More importantly, microplastics can absorb other pollutants, such as carcinogenic POLYchlorinated biphenyls (PCBS), polybrominated diphenyl ethers (PBDes), endocrine disruptors BPA and various agricultural drugs, which can be ingested by organisms and then released into their bodies, causing more serious consequences. Studies show that microplastics can in principle be transferred from the human gastrointestinal system to the lymphatic circulation, absorbed by the unborn baby through the placenta, and absorbed by the human body through the lungs, resulting in an immune system response that affects cellular health. The full impact of microplastics on the ecosystem is still being studied, but these preliminary results suggest that the harm may be far greater than what is currently recognized.
1.1.2 Biodegradable plastics tested by the market are the best alternative
Because of the country's disabled non-biodegradable plastic bags, plastic cutlery and disposable plastic straw policy is about to be carried out next year, starting in 2020, several brands chain drinks store and restaurants remove off the shelves of disposable plastic straw, plastic spoons, plastic forks, disposable plastic tableware, instead of paper straw, paper spoon, wooden fork. After New Year’s day of 2021, this phenomenon quickly spread to all catering industry.
However, after a period of use and feedback, consumers generally reflect that the experience of using paper straws and other replacement is too far from the previous experience. According to the results of instrument evaluation of paper straws used by some brands by many media, the paper straws in the test all performed disappointedly in the bearing capacity (corresponding to bite resistance), which was significantly lower than that of general plastic or degradable plastic straws. In the test of immersion resistance, all paper straws were deformed and bloated. What made the experience worse was that in actual use, especially in hot drinks, paper straws were softened and bent, and some of them even disintegrated, completely losing the function of straws.
In addition to the decrease of the physical function of the straw, there are also many problems in the taste and pass rate of the paper straw. The consumer feedback collected shows that most paper straws taste like paper, and some brands have obvious sour taste.
Other alternatives, such as wooden cutlery, have similar problems - consumers have complained that the front part of wooden spoons are too flat and hardly to be used effectively, and some products have a strong wood taste that affects the taste. Paper bags, which are used to replace disposable plastic bags, have potential safety hazards. When used to carry water, especially high temperature water, the physical properties of paper bags will be rapidly reduced and they cannot effectively carry objects. A paper food package of a famous chain restaurant brand once had an incident of scalding caused by hot drink falling from the bottom.
The primary tradeoff is cost in the early days when businesses looking for new straws to replace non-biodegradable plastics. According to the price comparison at that time, the unit price of plastic straw is only about 0.065 yuan/straw, the price of paper straw is about 0.09~0.14 yuan, and the price of PLA (PLA lactic acid) straw is 0.18~0.25 yuan/straw. Using PLA straw, the cost per straw is about 0.15 yuan higher than that of plastic straw. According to Nai Xue's tea prospectus, the average order quantity of a single store is about 608 orders/day from 2018 to q3 2020. according to the conservative data of 1 cup drink per order, and considering the 10% loss rate, the monthly cost of replacing the original plastic straw with PLA straw will increase by about 3000 yuan. While using the paper straw only increased by about 1,000 yuan, and the cost difference of replacing the 340,000 tea shops across the country is about 8.16 billion yuan per year.
As the paper straw using, consumers began to constantly give bad experience feedback and negative evaluation on the store operators, and some consumers even reduce the consumption frequency. At the same time, the initial price gap of paper straws and PLA straws because of shortage gradually ease when the the production capacity of both increase. The price difference between PLA straw and paper straw has been also reduced to only several cents. Finally, considering the impact on sales volume and the narrowing cost gap, the cost resistance of using PLA straw to replace paper straw and disposable plastic straw is no longer as big as before.
Similarly, for other disposable plastic cutlery, lunch boxes, packaging materials banned by the policy, biodegradable plastics have the lowest experience difference for customers because their properties are very similar to those of ordinary plastics. So for overly curved wooden spoons or unsafe paper food bags, the best solution is to replace them with a new generation of biodegradable plastics.
As markets verify that the degradable plastic is one of the best alternative to replace the original disposable plastic products after trial and error. The demand for biodegradable plastic products quickly blowout. Several plastic products company located in Jiangsu, Zhejiang, are in full production status during the Spring Festival, and the workers work in three shifts. Even during the Lunar New Year holiday, the factory arranged trucks delivering goods in full day. Because of the the downstream blowout, one of the effects for upstream is the skyrocketing prices of degradable plastics and their key upstream raw materials, notably the polylactic acid, PBAT and their upstream raw materials BDO.
1.1.3 Global policy resonance promotes inflection point of degradable plastics industry
As early as in 1999, China issued the " (99) No. 6 Order issued by State Economic and Trade Commission", which stipulated that the production and use of disposable foamed plastic tableware were completely prohibited by the end of 2000. “The Circular of The General Office of the State Council on Restricting the Production, Sale and Use of Plastic Shopping bags” was issued in 2007 to limit and reduce their use. In the wake of this, China issued a guideline banning or restricting the use of disposable plastic bags, tableware and packaging in four areas. Finally, in July 2020, nine ministries and commissions including the National Development and Reform Commission jointly issued “a notice on to enhance the work of preventing and curing the Plastic Pollution”, explicitly stating that non-degradable plastic bags, plastic tableware and disposable plastic straws will be banned from January 1, 2021. At the same time, in specific fields, the corresponding measures for subsectors such as "Agricultural Film Management Measures" and "Notice on Further Strengthening plastic Pollution treatment work in the Commercial Field" have been successively launched.
According to the above laws and regulations, the following production and sale of plastic products has been banned nationwide in 2021. In accordance with relevant policy, the facoty with illegal production and sales of plastic products prohibited by the state, will even be revoked of business license if cases serious , and fined 10,000 to 100,000 yuan: 1, 0.025mm ultra-thin plastic bags; 2, 0.01 mm polyethylene agricultural mulch; 3, non-degradable disposable straw (except the straw of milk, beverage and other food with packaging); 4, disposable foam plastic tableware; 5. Disposable plastic cotton swabs; 6. Daily chemicals containing plastic microbeads.
Western developed countries/regions, represented by the EU, realized the need for effective management of plastic waste earlier, so relevant policies and regulations were introduced earlier: In 1975, the European Union introduced a bill for planning to treat plastic waste, followed by a packaging act in 1994, which regulates recycling rates for various substances, including plastics, to reduce resource consumption.
In the past 10 years, countries and regions represented by the European Union have further introduced more policies and regulations to limit the use of non-degradable plastics through partial prohibition, restriction and other measures, and guide the public to reduce their dependence on plastic products. Most of these regulations prohibit the use of single-use plastic products at the consumer end. Among them, the most far-reaching regulations are the European Union's regulation that will impose a tax of 800 euros per ton on single-use plastic packaging in 2021 and the regulation that will directly ban/limit the use of dozens of single-use plastic products in 2021. The two regulations, aimed at upstream and downstream respectively, are enough to shake up the balance between supply and demand in the industry. In addition, although “the Guidance on Single-use Plastics (SUP)” issued by the European Commission on 31 May 2021 fails to update the previous classification definition of degradable plastics in a timely manner, given the rapid development in this field, the European Commission plans to develop a clear policy framework for biobased plastics (BBP), biodegradable plastics and compostable plastics (BDCP) in 2022.
Large enterprises, especially the chain enterprises in the face of globalization operation policy changes, in order to avoid adversely affection to their own business, tend to take action in advance, in response to expected changes, and some enterprises will carry out further actions than required to implement policies and regulations, from reserve margin of safety or for improving the enterprise's reputation and brand value perspective.
International liquor giant Pernod Ricard announced in 2018 that it would no longer use plastic straws and bartenders made of non-biodegradable materials in all of its global operations. McDonald's announced the launch of paper straw in June 2018, saying that it was part of a widespread effort to be environmental protection. Starbucks announced in July 2019 that it would stop using plastic straws worldwide and switch to paper straws by 2020, with more than 3,600 stores in China aiming to achieve the same goal by the same time. Pepsi said in 2019 that it would move away from single-use packaging so that all of its packaging would be recyclable, compostable or biodegradable by 2025. In August 2020, Nai Xue tea, Xicha, Michelle Ice City and other tea brands announced that they would replace plastic straws with paper straws or biodegradable straws in all stores across China.
If tea brands is driven by policy to avoid being forced to revoke the business license or fined to use environmentally friendly straw instead of disposable plastic straw, replacing the disposable plastic products out of the scope of this plastic ban is for the advertisement of the brand and ESG (environmental, social and corporate governance) considerations: On the one hand, implementing the regulations in advance is to avoid being punished or revoked business license when it is due. On the other hand, when enterprises publicize their environmental protection concepts to consumers, they can also demonstrate their social responsibility and improve their local reputation and brand value.
From overseas to domestic, and then to local, in recent years, restrictions on non-degradable plastic products have been issued intensively, management standards have become increasingly strict, and the circulation of disposable plastic products has been gradually tightened. From the domestic and abroad policy transmission and the implementation of the enterprises, a turning point in the degradable plastics industry was born under the resonance, and the enterprises’ advance layout and expansion of the implementation, further promoted the early arrival of the turning point.
1.2 New industry opportunities of Renewable polyester bottle chip
In addition to degradable plastics, there are also renewable plastics that are compatible with environmental policies and "dual carbon" goals: Plastic recycling is the process of recycling, cleaning and sorting waste plastics, regenerating them into slices and fibers that can be directly used in downstream plastic products by physical means (such as melting at high temperature), or decomposing them into small molecules and repolymerizing them into polymer materials by chemical means. At present, due to the cost problem, chemical regeneration has not been large-scale industrialized in the most common plastic varieties such as PE, PP, PVC, PET, and the mainstream way of regeneration is physical regeneration. Among them, because polyester bottle flakes are mainly used to manufacture beverage bottles and other food containers, their products are easier to recycle than thin and easily contaminated with oil PE film, plastic bags and so on. The recycling rate of polyester beverage bottles can reach more than 94% in China through waste pickup and other methods. Therefore, polyester bottle chip can greatly reduce the environmental pollution and carbon emissions in the whole life cycle through recycling and regeneration, which is one of the varieties with the highest application potential among renewable plastics.
1.2.1 Bottle chip have excellent characteristics and high cost performance
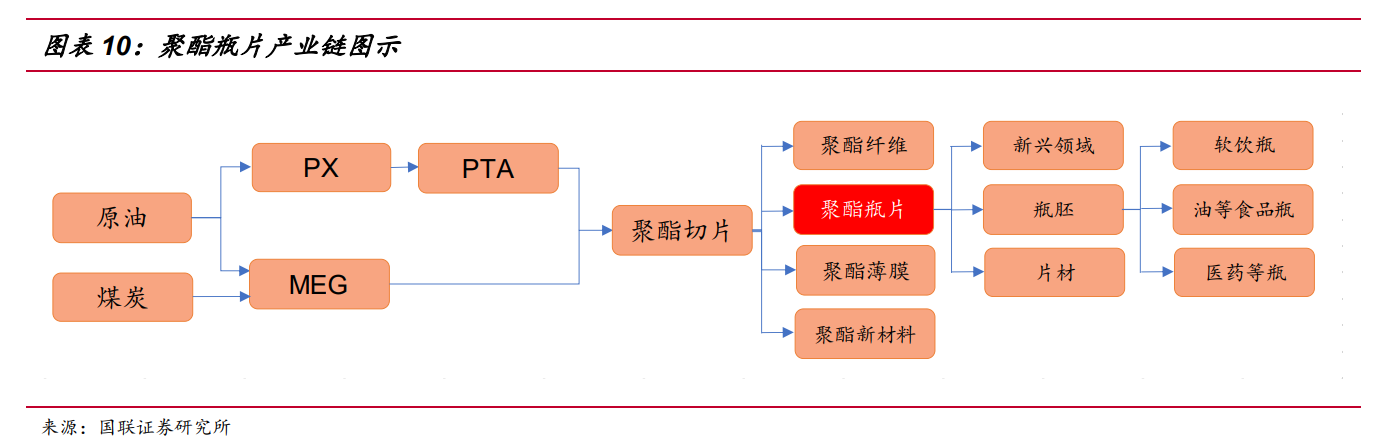
The full name of bottle chip is bottle grade polyester slice, which is a product form of polyester and a mid-stream product of polyester industry chain. It is mainly used to make packaging containers containing liquid. Polyester is the abbreviation of polyethylene terephthalate, PET for short, produced from the polymerization of refined terephthalate (PTA) and ethylene glycol (MEG).
The finished product form of polyester bottle chip is milky white or transparent particles with uniform size, which belongs to a kind of polyester slice. Because the polyester bottle chip belongs to a relatively high molecular weight of polyester varieties, the strength and barrier character has been further improved, so it is suitable for a variety of packaging fields, especially the liquid packaging of food and beverage, daily chemical industry and so on. Polyester bottles can be used to contain all kinds of complex systems with pressure and acid/alkali, alcohol and so on. Bottle chip is usually made into various bottle embryo, and then blown by blowing machine in independent or affiliated to downstream manufacturers such as soft drinks, bidirectional stretch blowing and filling of the contents.
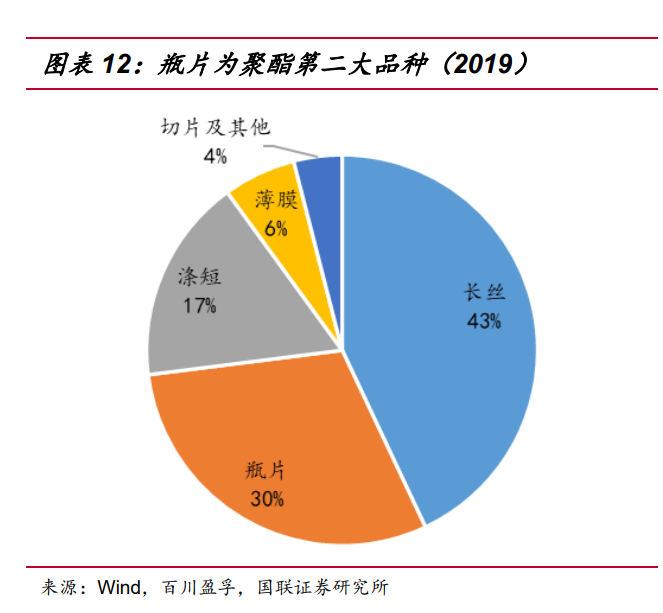
If the global polyester production capacity is divided by product form, polyester filament is the most productive variety, accounting for 43% of the global production capacity in 2019. The production capacity of polyester bottle chip is the second largest variety next to filament, accounting for about 30% of the global production capacity of polyester, and the production capacity of domestic enterprises accounts for 1/3 of the global production capacity of bottle chip, corresponding to about 1/10 of the global production capacity of polyester. Polyester staple fiber ranked third in polyester production capacity, accounting for 17%, followed by polyester film (6%), slicing and other polyester forms (4%). Although the proportion of textile fiber in global production capacity is still the largest, with the upgrading and replacement of the industry, the proportion of polyester used for packaging is gradually increasing: the proportion of non-fiber polyester products - bottle chip and film production capacity in recent years has gradually risen to around 36%.
Polyester bottle sheet has the following characteristics: 1. Good mechanical properties, good folding resistance, easy processing molding; 2. Resistant to oil, dilute acid/alkali and most solvents and chemicals; 3. Excellent resistance of gas, water/steam, oil and peculiar smell; 4. High transparency and good luster, both uv and static resistance; 5. Non-toxic and tasteless, can direct contact with food and other advantages. In the field of packaging, a well-known example is the substitution process of polyester bottle to glass bottle.
Polyester bottle ship not only replace inorganic materials such as glass, but also compete with other kinds of polymer materials and biomass materials. The replacement with glass and aluminum and other metals is the earliest, and its advantages are mainly in: 1. Polyester bottle packaging is not easy to be broken due to collision and other factors in the process of transportation; 2. There is no need to pay the cost of recycling and cleaning the glass bottles after use; 3. Polyester bottles with the same capacity are much lighter than glass and metal, which has a significant advantage in transportation costs.
The logic of polyester bottle chip replacing other kinds of polymers is different from that of glass and metal. Because the density and physical properties of each polymer are relatively close, the replacement process is mainly dominated by food safety, transparency, cost performance and other more subdivided attributes. At present, PET mainly has a direct replacement relationship with glass, aluminum, paper, high density polyethylene (HDPE), polypropylene (PP) and so on.
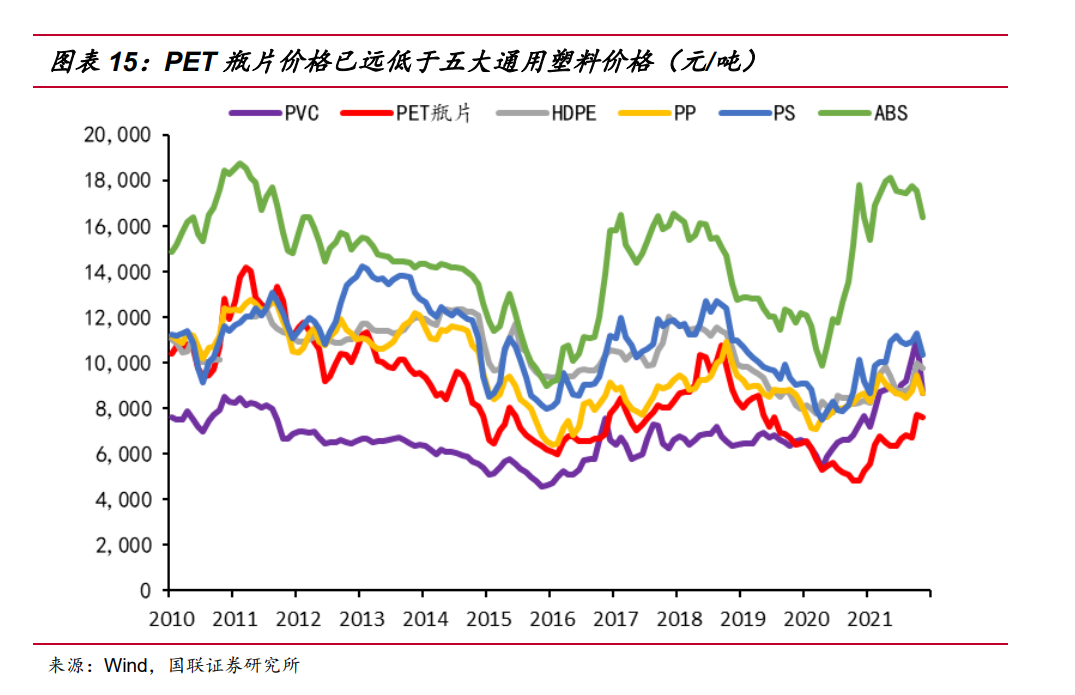
Reviewing the price curves of polyester bottle chip and five general plastics in the past 10 years, we can see that before 2020, the price curves of bottle chip and PP are staggered several times, generally slightly lower than PP price; At the same time, it interlaced with HDPE and PS only in the early stage, and remained lower than both in the late stage. And it never close to ABS price, has been thousands of yuan lower than its market price; There was a price intersection with PVC, which was nearly 1000 yuan/ton higher than its price for a long time.
Due to the impact of pollution reduction, emission reduction, energy saving policies and the subsequent changes by the epidemic, the structural imbalance in the price of bulk commodities has caused polyester bottle sheets to be cheaper than the five general plastics for a long period of time (from the beginning of 2020 to now). Currently, PVC and PP prices which is most closest to polyester bottle sheets, are higher than 1000 yuan/ton. Currently, downstream manufacturers are suffering from higher commodity prices, and most are seeking to replace high/high material prices with cheaper materials to repair damaged gross margins.
The current low price of PET bottle chip is unsustainable. On the one hand, this trend makes the downstream start to try to directly replace high-priced plastic varieties, aluminum, glass, paper, etc. On the other hand, there is also the possibility of indirect substitution. It is assumed that PET and MATERIAL A were competing with material B before, but the price of material A has risen to higher than PET. Therefore, in the mutual substitution with MATERIAL B, part of the original share that should be replaced by material A will be replaced by PET due to the price increase factor. The substitution process mentioned above will further expand the demand for bottle chip. In addition, as polyester is a recyclable polymer, it has formed a relatively complete recycling industry chain, which is more beneficial under the background of pollution reduction and dual carbon policy. After showing significant cost-performance ratio of competing products, the bottle chip industry may start a new round of volume and price rising and price repairing caused by replacement effect, thus improving the profit margin of the industry chain.
1.2.2 The downstream demand for bottle chip is growing strongly
The total production capacity of domestic polyester bottle chip increased from 4.14 million tons in 2010 to 11.99 million tons in 2020, nearly three times the capacity expansion, with an annual growth rate of 11.22% in 10 years. Meanwhile, bottle chip production increased from 3.31 million tons in 2010 to 8.7 million tons in 2020, with CAGR-10 at 10.15%. The bottle chip consumption CAGR-10 was 9.35%, basically keeping pace with the supply.
The proportion of the domestic demand consumption in the apparent consumption showed a trend of decline first and then increase in the decade. Before 2015, the growth rate of export was faster than that of consumption, showing a trend of export driving. The negative growth in 2015 was due to the release of capacity of bottle chip factories and overseas competitors, so there were a number of "double countervailing" investigations against Chinese bottle chips. After 2015, due to the suppression of exports, the proportion of consumption gradually increased, and the pattern dominated by domestic demand was further strengthened. Another downward trend in exports in 2020 was due to the suppression of exports by the epidemic and lack of shipping capacity.
Monthly data from 2019 to 2021 show that the growth of bottle chip consumption is almost unaffected by the epidemic: From January to September, there was a year-on-year increase in 4 months and a year-on-year decrease in 5 months. However, from the perspective of volume, the year-on-year decrease in monthly data was actually small, ranging from 7 to 22%, while the year-on-year increase in 4 months, Including January, March and July, was significantly increased, with an increase of 60 to 102%. The total consumption in the first nine months increased by 11.07% year-on-year, and CAGR-2 consumption in the first nine months was 10.94%, significantly higher than the pre-epidemic level of CAGR-3 of 7.68% from 2016 to 2019.
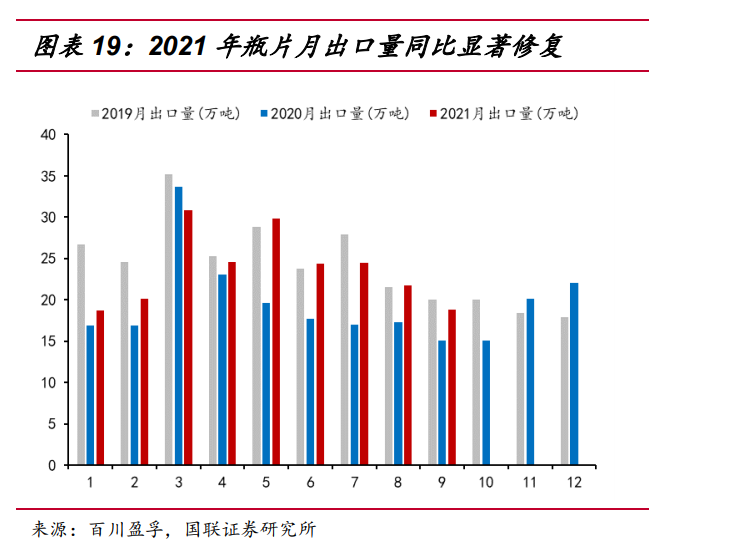
Customs export data indicate that post-covid-19 bottle chip exports are recovering to close to 2019 levels: According to the monthly customs data of 2021, the bottle chip export showed a year-on-year increase in 8 out of 9 months (with a year-on-year increase of over 10% in 7 months and 50% at most), and only decreased by 8.59% in March, with a year-on-year increase of 20.44% in the first Nine months. But it is still 8.74% behind the first nine months of 2019. On a monthly basis, it can be seen that the export gap between 2021 and 2019 is generally narrowing month by month and is gradually being repaired to the level of 2019. According to consumption and import and export data, although the epidemic brought disturbance, it did not affect the growth trend of bottle chip consumption, which increased by 5.23% year-on-year in the first nine months of 2021 and 6.17% compared with 2019.
Under the general trend that global commodity price rise and then transmission to the consumer end, enterprises has been encouraged to upgrading through packaging transformation. In addition to the previous consideration of improving product structure to improve profit margins, enterprises are also faced with the problem of cost increase caused by price transmission. It is urgent to achieve the purpose of increasing price through update polyester bottle packaging and develop new products, typical of which is the new demand represented by dairy packaging. In addition, the main body of bottled water market maintained a high growth rate, coupled with the emergence of new categories such as sparkling water and new applications such as sheet metal, together constitute a strong downstream demand.

1.2.3 The bottle chip industry presents a good supply and demand pattern
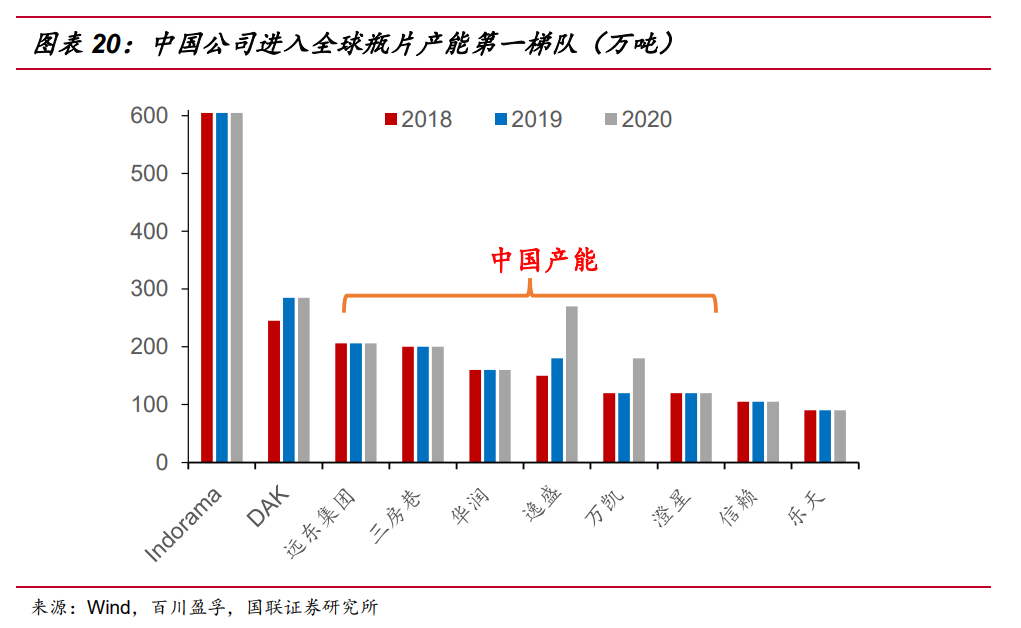
In terms of global bottle-grade polyester chip production capacity distribution, the current production capacity is mainly distributed in The Asia-Pacific region represented by China and India. Among them, China's bottle-grade polyester chip production capacity ranked first in the world. The global production capacity accounted for 35% in 2020. The remaining capacity is mainly distributed in regions such as North America (14% of global capacity), the European Union (10% of global capacity), and the Middle East and Africa (9% of global capacity).
With the transfer of the global bottle-grade polyester chip industry, some European and American companies sold or closed PET production devices; Companies in the Asia-Pacific region continued to grow in size despite there are plants shutdowns. In the next few years, new/expansion projects of bottle-grade polyester chip are still mainly concentrated in the Asia-pacific region, thus promoting the further expansion of bottle-grade polyester chip capacity in the Asia-pacific region.
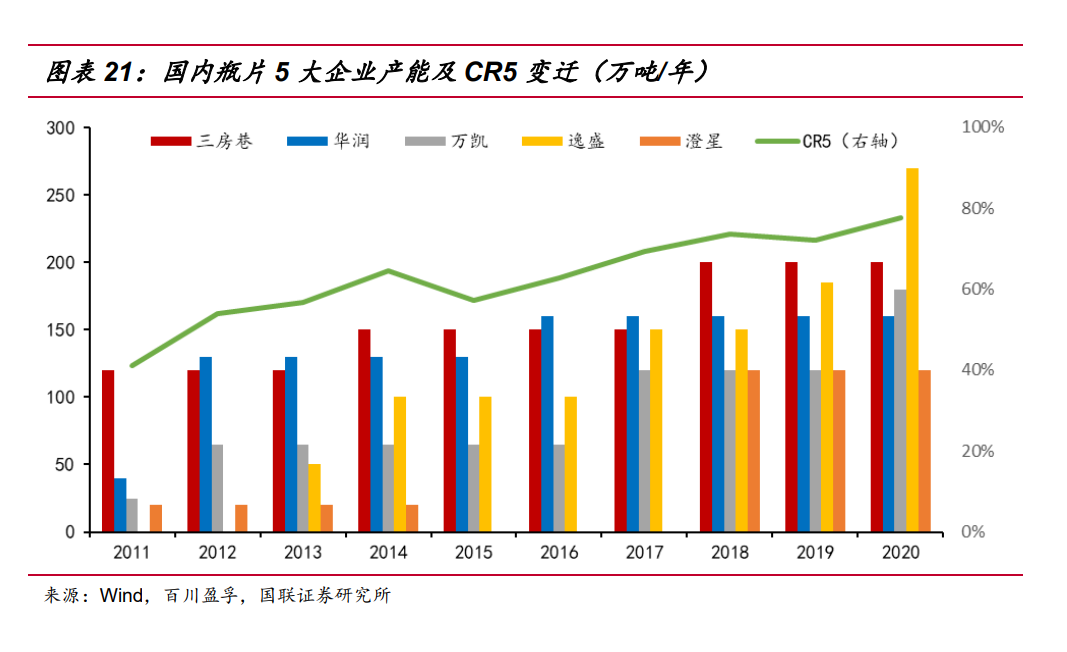
China's total bottle chip production capacity ranks first in the world, among which the five domestic bottle chip manufacturers sanfangxiang, China Resources, Wankai, Yisheng and Chengxing have a decisive influence on the industry: the capacity of the five enterprises continues to expand, from 2.05 million tons to 9.3 million tons in 10 years, with a compound annual growth rate of 16%. At the same time, the concentration rate of five enterprises (CR5) also maintained a rapid growth, from 2011, the total capacity of five enterprises accounted for 41% of the domestic bottle chip industry capacity, to 2020, 77.56%, nearly double. The type of market structure is extremely oligopolistic (CR8≥70%), and the leading players' discourse power in the market is increasing day by day.
According to the giant's expansion plans and long-term strategic planning some enterprises/consultancy disclosed , the next five years, including SanFangHang, China resources materials, domestic enterprises will also further expansion, the expansion will faster than overseas giant Indorama and DAK, so as to make the domestic enterprise capacity in the world rankings to rise further. The market share of China's regional production capacity will be further expanded and the market discourse power will be further enhanced. From the expansion track of the past ten years and the strategic arrangement of the next few years, it can be seen that the domestic bottle chip giant is through controlling the good pace of production expansion, step by step to improve the capacity and set up the industry competition barriers.
According to the company's disclosure, Sanfangxiang's customers include Coca-Cola, Pepsi, Nongfu Spring, Yihai Jiali, Master Kong, Wahaha, Danone group and other well-known domestic and foreign food and beverage enterprises. The sales volume of the top five customers in 2020 accounted for 18.23% of the total annual sales volume. In 2020, the top five customers of China Resources Materials are Coca-Cola Group, China Resources Ibao Group, Dingjin Group, Nongfu Spring Group and Jinmalang Group, accounting for 24.47% of the total sales volume (28.79% and 27.30% of the top five customers in 2018 and 2019 respectively). Among them, Coca-Cola group with the highest sales proportion accounted for 6.45%. The sales of the top five customers account for 15.22% of the total annual sales of Zijiang enterprise in 2020. It can be seen that typical enterprises in the bottle chip industry have low customer concentration in the downstream.
In terms of the industry as a whole, apparent consumption consists of domestic demand (domestic market demand) and external demand (export overseas demand). Most of the domestic demand comes from the procurement of beverage enterprises, among which the top 5 customers in 2019 are Coca-Cola (about 10%), Nongfu Spring (about 10%), Tingyi (about 9%), Wahaha (about 7%) and Ippo (about 7%), and the INDUSTRY CR5 is about 43%. Bottle chip manufacturers is much lower than that of upstream manufacturers CR5(77.56%), showing a more dispersed industry pattern.
The export volume of bottle chip consumption is mainly contributed by Sanfangxiang, Wankai, Yisheng and China Resources, CR4 reaching 78%. In contrast to the high concentration upstream, bottle chip flow to a much more dispersed region: The top 10 export regions are India, the Philippines, Russia, Algeria, Peru, Chile, Ukraine, Indonesia, Kazakhstan and Vietnam, with India at the top accounting for about 9%. The CR4 and CR10 exports of each region were 24% and 43% respectively. The downstream was also more dispersed than the upstream. Under the more decentralized pattern of downstream, the influence and control of bottle chip manufacturers on the market have been improved.
2. 2022 Investment strategy
2.1 Alternative space beyond expectations brings biodegradable upstream opportunities
2.1.1 Domestic alternative space brought by short - and medium-term policy
According to “the Notice on Solid Progress in The Treatment of Plastic Pollution” jointly issued by nine ministries and commissions including the National Development and Reform Commission, and “the Subsequent Measures on the Management of Agricultural Film” and “notice on Further Strengthening the Treatment of Plastic Pollution in the Commercial Field”, we believe that non-degradable plastic bags, disposable plastic tableware, hotel disposable products, express plastic packaging and agricultural film are the alternative space brought by direct policy drive in the short and medium term. According to our calculation, after the implementation of the plastic ban in 2025, these five fields will bring about 4 million tons of replacement space for degradable plastics, equivalent to a market size of nearly 80 billion yuan (detailed calculation is as follows).
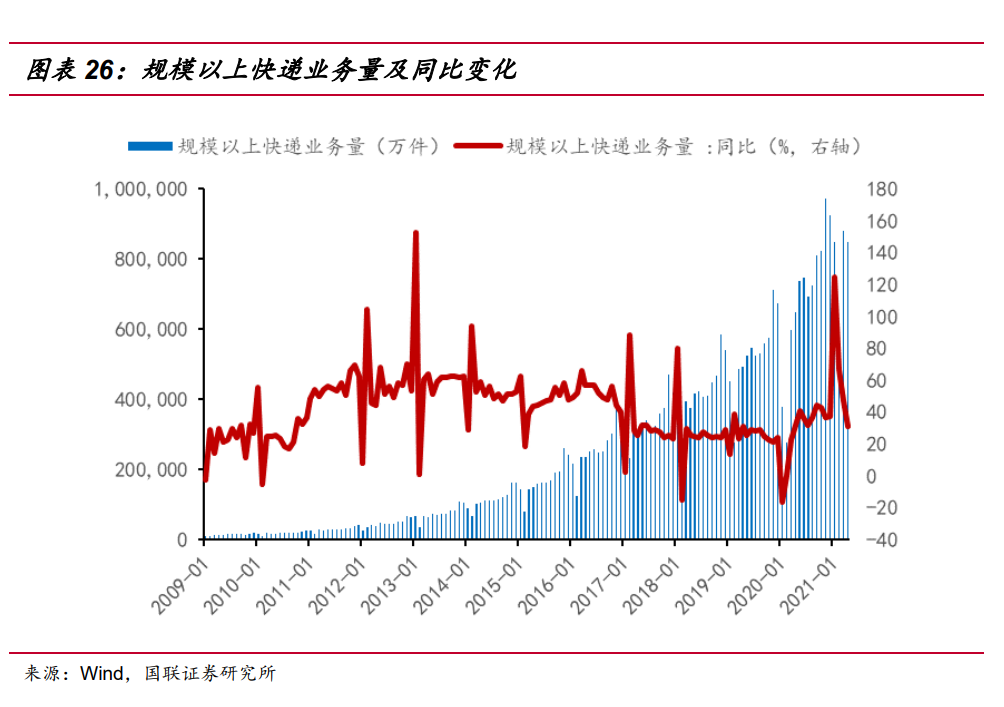
According to the data in 2020, the total number of express businesses above the scale in China reached 83.36 billion, with a year-on-year increase of 31.23%. The express business volume increased by about 35 times in 10 years from 2010 to 2020, with a compound growth rate of 42.95%. Since 2017, the growth rate of express delivery has become relatively stable, and in 2021, the volume of express delivery surged again -- the monitoring by the State Post Bureau shows that the volume of express delivery in 2021 exceeded 50 billion pieces (as of July 4), close to the level of the whole year of 2018. We conservatively take the three-year average growth rate of 27.69% from 2018 to 2020 as the growth rate in 2021, and further predict the future express delivery volume at the annual decline rate of 2PCT.
Beijing, Shanghai, Jiangsu, Zhejiang, Fujian, Guangdong and other key provinces and cities will be pilot a ban on single-use plastic packaging, and non-degradable plastics will be banned for express delivery in these provinces and cities by 2022, and banned throughout the country by 2025. According to the data of 2019, the express business volume of the above-mentioned provinces and cities accounted for 48.17% of the total express business volume of China. According to the existing express packaging structure (plastic packaging accounts for 41%, of which plastic film accounts for 63%) and 40.87 grams of plastic are needed for each express plastic bag, the corresponding express industry degradable plastic replacement market scale is about 1.64 million tons by 2025.
In 2019, the scale of China's food delivery industry was 653.6 billion yuan, increase 39.3 % from 2018. At the same time, the penetration rate of the takeout industry also continues to rise. The penetration rate of the takeout industry reached 14.0% in 2019, increased 3% from 11.0% in 2018. Meituan's 2019 financial report shows that in 2019, Meituan's food and beverage takeaway business continued to maintain a strong momentum of growth, with the number of annual transactions up 36.4% year on year to 8.7 billion, the value of transactions up 38.9% year on year to 392.7 billion yuan, and the average daily number of transactions up 36.4% to 23.9 million. The average value of each order was up 1.8% year on year. By the end of 2019, there were about 460 million takeaway consumers in China, up 12.7% from the end of 2018, accounting for 50.7% of the 900 million Internet users. According to data released by the National Bureau of Statistics, China's urban resident population was 848.43 million at the end of 2019, takeaway food consumers accounting for 53.9 % of the country's urban resident population.
According to the data of Meituan Delivery, in 2019, China's instant delivery orders reached 18.28 billion orders, of which take-out orders accounted for 70% or about 12.796 billion orders, corresponding to the average of 27.8 orders per 460 million consumers per year, with an average of more than 13 days to order, there is still upside potential for improvement. In addition, considering that the penetration rate of the takeout industry continues to increase and the number of transactions grows rapidly in recent years. We estimate that the growth rate of 36.4% in 2019 will decrease to 19.34% in 2025, and the takeout orders will reach 49.996 billion in the same period.
According to the study, the weight of a single plastic bowl and plastic lunch box is basically about 40 to 60 grams, and the plastic spoon or fork weighs 2 to 3 grams. According to a survey by an environmental protection organization, each takeout consumes an average of 3.27 lunch boxes. According to the calculation of 3 lunch boxes (50g/ box) +1 plastic bag (5G) for each takeout, if the weight of the spoon is ignored, each takeout will produce 155G discarded plastic. Considering the target of reducing consumption intensity of non-degradable disposable plastic tableware by 30% in the food delivery area of prefecture-level in above cities in 2025, the replacement space of degradable plastic in the food delivery order area is estimated to be 1,394,900 tons by 2025. At the same time, data showed that the total production of plastic products in 2019 was 81.84 million tons, including nearly 30,000 tons of plastic straws, while the replacement space for disposable tableware and plastic straws in the takeout field was 1.42 million tons.
In the field of non-degradable plastic bags, in addition to the demand involved in take-out, the rest of the demand mainly lies in shopping malls, supermarkets, drugstores, bookstores, exhibitions, trade markets and other entity business places. By the end of 2020, non-degradable plastic bags will be banned in the above places in the urban built-up areas of municipalities directly under the central Government, provincial capitals and cities separately listed in the state plan (the use of non-degradable plastic bags is regulated and restricted in market markets), and by the end of 2022, the implementation scope will be expanded to all urban built-up areas at prefectural level and above and coastal county built-up areas. By the end of 2025, non-biodegradable plastic bags will be banned from markets in the areas.
In terms of the population involved in the region, the above-mentioned policies will involve a population of 500 million by 2025, and each person consumption of 4 plastic bags per week in the region will be equivalent to 1.04 kg/year, corresponding to the market demand for degradable plastic bags of about 520,000 tons. According to another algorithm, according to the statistics of the Plastic Recycling Committee of the China Plastic Association, China uses about 3 billion plastic bags every day. As of 2019, the annual use of plastic bags is more than 4 million tons, among which the non-degradable plastic bags in the above-mentioned regional markets and shopping malls account for only 10% to 20%. At least 400,000 to 800,000 tons/year of replacement space.
In 2019, the Ministry of Agriculture and others jointly issued “the Opinions on Accelerating the Prevention and Control of Agricultural Mulching Film Pollution”, requiring that a plastic recycling system should be basically established by 2020, and the recovery rate of agricultural film should reach over 80%. By 2025, agricultural film should be completely recycled. In 2020, the Ministry of Agriculture and other ministries and commissions jointly issued “the Agricultural Film Management Measures”, in addition to agricultural film recycling, specifically proposed to encourage and support the production and use of fully biodegradable agricultural film. According to the calculation of 2.407,700 million tons of agricultural plastic film used in 2019, the recovery rate of agricultural plastic film is difficult to improve in the future due to its low recycling value. In 2020, the proportion of unrecycled agricultural film is less than 20%. If 80% of this part is converted to biodegradable plastic material in the next five years, 385,200 tons of replacement space will be created for the agricultural film industry. Together, these sectors add up to 3.9652 million tons of replacement space for the biodegradable plastics industry by 2025 (ignoring the smaller hotel disposables).
On February 9, 2021, the Office of state Administration of China, the General Office of the Ministry of Housing and Urban-Rural Development, and the General Office of the National Development and Reform Commission issued the Notice on “The Recent Key Work of Domestic Waste Classification in Public Institutions (NO. 4, 2021)”, in which the third point requires that by the end of 2021, all non-degradable disposable plastic products listed in the List of Non-degradable Disposable Plastic Products Ceased to Be Used in Public Institutions (Batch 1) shall be discontinued in public Institutions. The List of Non-degradable Single-Use Plastics Discontinued by Public Institutions (The first batch) is explained in particular in the form of a negative list, Non-degradable material refers to polyethylene (PE), polypropylene (PP), polystyrene (PS), polyvinyl chloride (PVC), ethylene-vinyl acetate (EVA), polyethylene terephthalate (PET) and other non-biodegradable polymer materials, in other words, Degradable materials shall not contain the above PE, PP, PS, PVC, EVA, PET.
2.1.2 Alternative space brought by medium and long term overseas market
In addition to the short to medium term policy alternative space in the domestic market, because our country is the world's manufacturing and a large number of foreign trade is plastic and polyester fiber spinning clothing products for export, affected by policy, the European Union and other regions and countries, these products are facing Europe and the United States and other developed countries and regions of the biodegradable policy to upgrade.
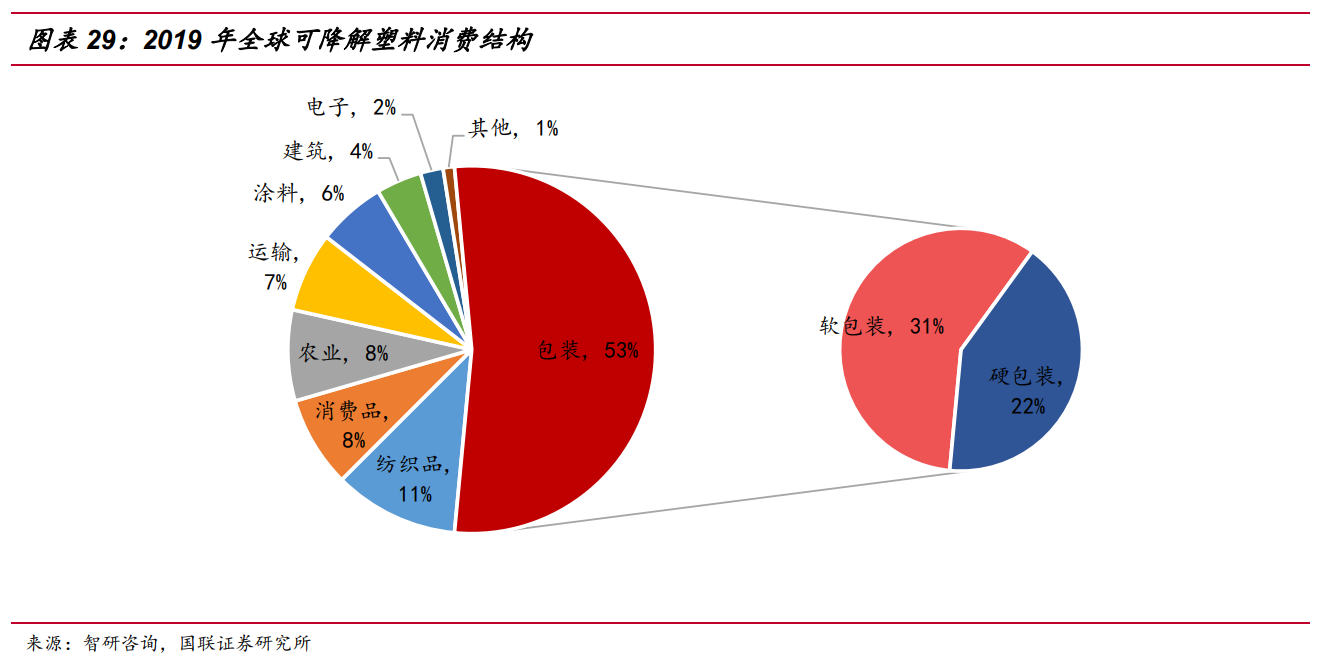
1. According to the category of plastics, the demand for polyethylene was the highest in 2019, with 105 million tons, accounting for 41.2% of the total demand. Polypropylene demand was 76.3 million tons, ranking second, accounting for 29.9% of the total demand. Polystyrene demand was 17.78 million tons, accounting for 7%. The above three types of plastic materials are mainly used to manufacture disposable plastic bags, containers, packaging films and tableware, but also the highest frequency of Marine microplastics varieties. In the long run, most of the demand for all three will be replaced by biodegradable plastics. In the total demand of nearly 200 million tons, sensitivity analysis is made according to the real replacement rate of 20-60% in different stages, corresponding to the global total replacement space of 2388 to 71.67 million tons/year. According to the current global production capacity of degradable plastics, the domestic production capacity accounts for far more than half, and the conservative market share of 1/3 in the future is calculated, corresponding to 7.96 ~ 23.89 million tons of global replacement space.
2. In terms of product application, the world produces about 100 million tons of plastic bags and tens of millions of tons of plastic film every year. If the sensitivity analysis is carried out with replacement rates of 20%, 40% and 60%, the replacement market space brought by plastic bags alone is 20-60 million tons per year. China produces more than a quarter of the world's plastic each year. Even if calculated according to the equal proportion replacement rate, it can occupy the replacement space of 5 ~ 15 million tons of plastic bags in a single category. Counting plastic film, packaging materials and other fields, the replacement space is also the market size of 10 million tons.
3. Take the textile chemical fiber, plastics and their products imported from China by EU as an example and have indicated that they will regulate the content of degradable plastics in the future. Based on the three types of products imported by the EU from China in 2019, the total amount of these three products is 4.3576 million tons. Based on the sensitivity of degradable plastics accounting for 20%, 50% and 80% of the total imports by 2025, there are 87, 218 and 3.49 million tons of degradable plastic replacement space corresponding to three kinds of materials respectively. The estimates do not include clothing, shoes, hats, yarn and traditionally more important export categories such as toys and furniture, which are also important applications for all types of plastic. The annual production capacity of polyester filament, a chemical fiber category in China, exceeds 43 million tons, corresponding to the same level of textiles, a large number of which are used for export. Based on this, we roughly calculate the main fields involved in the important export regions such as the EU and the United States, and the total replacement space may be 10 million tons.
From a longer perspective, according to l. Shen et al. 's opinion summarized by interviews with industry experts in the documents, 31% is the maximum permeability that can be calculated for biodegradable plastics under the performance gap existing between several types of biodegradable plastics and ordinary petroleum-based plastics. Based on this maximum penetration rate and global plastic production in 2021, more than 120 million tons/year of global plastic capacity will be replaced by biodegradable plastics in the long term, resulting in more than 30 million tons/year of domestic demand for biodegradable plastics based on a one-fourth proportion.
2.1.3 Intensive production capacity brings opportunities to upstream key raw materials
With the intensive implementation of policies in the past two years, the future market space suddenly appear, and enterprises are enthusiastic about expanding production, and have announced plans to expand production or build new production capacity. At the beginning of 2021, the domestic PBAT capacity will be 687,000 tons, with a planned capacity of 4.633 million tons. By the end of the third quarter, a total of 71 companies announced the layout of PBAT. The long-term planning of PBAT existing, under construction and planning capacity has soared to 18.861 million tons. According to the manufacturer's production capacity delivery plan, it is expected that more than 30 projects, including Wanhua Chemical, Jinfa Technology, Donghua Tianye, Sanfangxiang, Jindan Technology, Lanshan Tunhe, Huafeng Environmental Protection, Hubei Yihua, Huayang Pingding and Daoen Shares, will have over 2 million tons of PBAT production capacity from 2021 to 2022.
In 2020, Like PBAT, China's PLA industry also achieved breakthroughs: In June, BbCA group put into operation a production line with an annual output of 50,000 tons of PLA; November, Jindan biological lactide project trial run; In December, Zhejiang Haizun phase I 30,000 tons/year polylactic acid production line was put into operation, which began to impact the PLA and lactide production links previously controlled by overseas giants. At present, there are bbCA 300,000 tons/year, Haizun 30,000 tons/year, Jinfa 30,000 tons/year and other polylactic acid projects under construction. According to the capacity construction plan, an additional 560,000 tons of polylactic acid capacity will be added from 2021 to 2022. Plus a large number of long-term polylactic acid capacity planning, as of October 22, The PLA's existing, under construction and planned capacity has increased to 4.516 million tons/year.
1. PBAT value chain analysis
Three commonly used methods for the production of PBAT include coesterification (direct esterification), partial esterification and series esterification. From the perspective of industry, BASF process with low acid value and high molecular weight is superior. However, through the continuous research and development of domestic scientific research institutions and manufacturers, the trend of technology diffusion has been formed, and domestic technology has formed a number of engineering achievements. In the future, the capacity bottleneck of the industrial chain may not be in the aggregation link. At present, the PBAT capacity is expanding rapidly, and the engineering construction cycle of medium capacity aggregation production line is usually about one year.
The rapid increase of downstream demand benefits the whole PBAT industry. Although there are fluctuations in supply and demand during the industrial upswing, with the implementation of policies, there will still be a shortage of capacity at the aggregation end of the middle reaches of the industrial chain in the short and medium term. As the capacity expansion of upstream raw materials BDO and AA is much slower than the aggregate capacity of PBAT, it may be in shortage for a long time in the future, so the value link of the industrial chain may spread to the raw material end.
At present, the existing, under construction and planned PBAT capacity has reached 18.861 million tons/year, and the corresponding new BDO demand is about 11.317 million tons/year. However, the current effective total domestic production capacity is only 2.234 million tons/year, and the new production capacity is expected to be 2.199 million tons/year in the next three years. Even with the long-term planned capacity, the gap between supply and demand in the future is more than 6 million tons per year. Meanwhile, the corresponding demand for additional AA is about 7.544 million tons/year. Currently, the effective total AA production capacity in China is about 2.75 million tons/year. In the next three years, it is expected to put into production a new capacity of 420,000 tons/year. Under the background of the rapid expansion of PBAT capacity, participating enterprises need to seize the market quickly and reduce production costs as soon as possible. Currently, integrated enterprises supporting BDO, AA and other raw materials in the capacity under construction can better control costs, and will always be in an advantageous position in the subsequent competitive situation where raw materials may be shortage.
2. PLA value chain analysis
There are mainly two theoretical synthesis routes of PLA: "one-step method", namely direct condensation of lactic acid. The advantage of this method is that the conversion rate of lactic acid monomer is high and the synthesis route is simple, but the water generated in the process is difficult to remove, resulting in low molecular weight and poor quality of the product. The "two-step" method, namely ring-opening polymerization, is the main process synthesis route at present. It generates oligomer through lactic acid, then depolymerizes to generate intermediate lactide, and finally prepares PLA through ring-opening polycondensation of lactide. The product quality is guaranteed, but the process is long and the cost is high.
At present, The production barrier of PLA is still high, mainly because the lactin technology of its upstream key raw material has not been completely broken through in China. Therefore, the capacity expansion speed of PLA is slower than that of PBAT even though the industry demand is experiencing rapid growth due to the limited supply of raw materials. At present, the PLA production expansion project under construction in China is mainly 300,000 tons of BbCA. Zhejiang Haizheng has also mastered lactide synthesis technology. In addition, jindan Technology, a domestic listed company with a capacity of 10,000 tons of lactide, completed the lactide production process after the trial run in November 2020, and Wanhua also promoted the PLA project to the pilot trial stage. We believe that with the breakthrough of lactide technology made by many enterprises, the bottleneck of raw materials in China is expected to be alleviated in the future, bringing rapid increase of PLA production capacity and cost reduction.
The upstream of PLA lactide is lactic acid, which comes from the fermentation of biomass materials such as corn. From the perspective of resource endowment of each country's development, America is rich in biomass raw materials, especially the United States and Brazil, which have unique cost advantages and have successfully operated in many fields such as bioethanol. It is expected that after the technological breakthrough and diffusion of PLA and lactide, with the expansion of production capacity, the value link of the industrial chain will gradually move from lactide and PLA to lactic acid upstream, and the final competition will be the cost advantage of the whole industrial chain.
Considering that food is the red line in Asia, especially for populous countries such as China and India, the proportion of lactic acid produced by grain fermentation is not high under current calculation, but large-scale expansion of production may promote local imbalance between supply and demand in a specific time period and climate. Only when the carbon emissions constraints biological advantage and crop planting area is abundant enough, or food fermentation route upgraded to straw biomass fermentation route, the PLA's expansion didn't trouble back at home, the biodegradable plastics market will continue to give priority to with diversified and expansion can, short-term rely on petrochemical feedstocks and biomass feedstocks double route - many varieties of development.
2.2 Loose raw materials and low inventory open the harvest period of bottle chip industry
2.2.1 The increase of raw material supply and the strong demand in off-season are both good for the industry
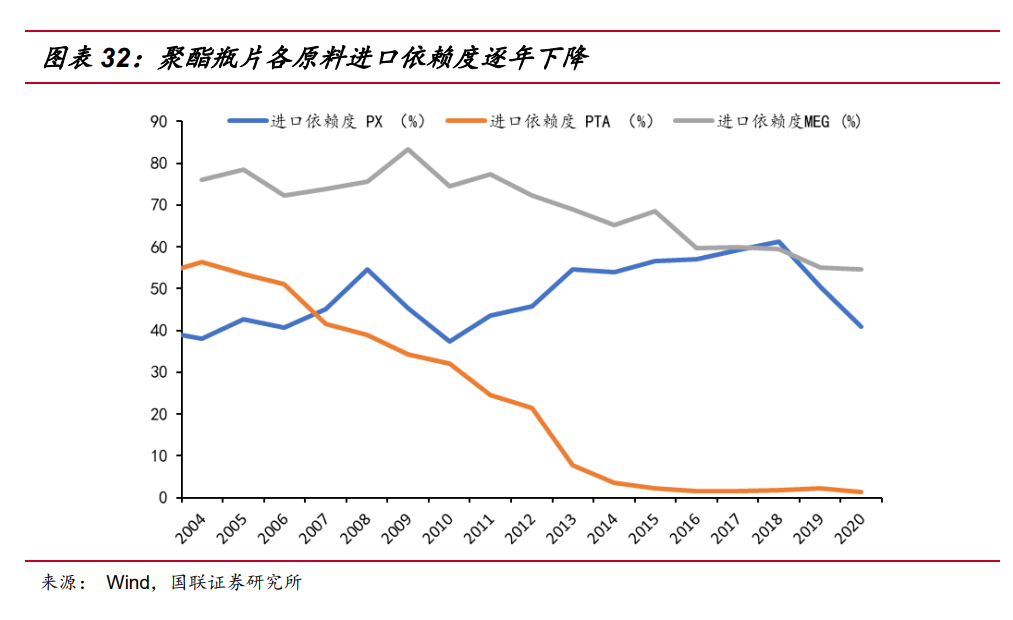
Previously, PTA-polyester industry chain was subject to high import dependence of upstream raw materials, and most of the profits of the industry chain were often shared by overseas upstream raw materials PX (paraxylene), MEG (ethylene glycol) manufacturers. However, with the accelerated expansion of domestic private refineries and the centralized construction of domestic coal-to-ethylene glycol capacity in recent years, the import dependence of PX and MEG has shown a significant downward trend in recent years: MEG import dependence has decreased from 83% to 55% in the peak period, a decrease of 28 PCT, and PX dependence has also decreased from 61% to 41%, a decrease of 20 PCT, and with the subsequent production of The second phase of Zhejiang Petrochemical and Shenghong Refining, PX import dependence is expected to continue to decline. Make polyester upstream raw material supply further loose. This trend makes the cost end of bottle chip in the expectation of improvement, which is conducive to the downstream movement of polyester industry chain profits.
In previous years, the inventory of polyester bottle chip gradually decreased before the peak season of domestic consumption in summer, and then gradually accumulated inventory in the peak season and after the peak season. However, in 2021, with little change in the annual average operating rate, bottle chip inventory continued to decline after the peak season and there is no sign of a trend reversal so far, with a drop of 69% compared to the high before the beginning of the year. This is due on the one hand to the strong domestic market demand from the beginning of 2021, and on the other hand to the gradual recovery of overseas markets from the epidemic and the continuous recovery of monthly exports. The favorable situation of low inventory makes manufacturers have an advantage in bargaining with the downstream, which is conducive to the expansion and maintenance of processing profits.
2.2.2 Repair of processing price gap and tight balance between supply and demand in the future start the industry boom
Reviewing the profitability of bottle flakes in the past 10 years, although the supply of various raw materials such as PTA, PX and MEG was once restricted, the processing price difference of bottle chip was more stable compared with other cycle products due to the continuous improvement of downstream consumer demand and a large number of rigid demands in the demand structure. Even though the industry giants kept expanding and competing fiercely in the previous development process, the acceptable processing price difference of bottle chip was maintained in most of the time. The average price difference between bottle chip and raw materials PX and MEG is around 1660 yuan/ton since 2011. Due to the jump in upstream raw material capacity, the continuous loose raw material supply pattern with high probability is expected to maintain the industry's low raw material cost state and further expand the price difference, bringing safety cushion and considerable profit elasticity for the operation. At present, the processing price differential has been starting the upward repair, from the low point 1029 yuan/ton in July, 2021, and the industry has entered the harvest period.
Under the background that the impact of the epidemic on the global economy is gradually slowing down with the increase of vaccine coverage rate and the global bottle chip demand is gradually recovering. We make the following assumptions and estimates for the industry: The consumption growth rate from 2022 remains a conservative CAGR of 7.68% in the three years from 2016 to 2019; The recovery time of export volume will lag behind. After the repair process is completed, from 2023 the growth rate of export volume will keep at a CAGR of 13.54% from 2016 to 2019. Imports are estimated as a fixed proportion of consumption and inventory changes are ignored. Can get the result: the corresponding bottle chip production (= consumption and net exports) is estimated to reach 12.64 million tons in 2023, with a three-year CAGR of 13.25%. From 2020 to 2023, the planned new production capacity is about 3.2 million tons (excluding the elimination of capacity), and the estimated bottle chip production can increase by 3.94 million tons. The new industry capacity is within a reasonable range, and the industry supply and demand pattern will maintain a tight balance, and the bottle chip industry chain will benefit accordingly."